Tuesday, September 30, 2008

Two charts


Brain's book: Dominant themes throughout the book include the fact that price is the most important factor to consider, nothing else (even volume, which often expands after price moves, not before); that one must trade only what one sees, not what one thinks; the supreme importance of avoiding large losses and protecting capital; how one should listen only to the market and to price action, never to opinions; and perhaps most importantly, that in order to have the odds in one’s favor, one must trade with the prevailing trend (and not just the major trend, but the intermediate and minor trend as well).

Monday, September 29, 2008

Failed Bail Out plan

The Dow told the story of the market's despair. The blue chip index, dropped by hundreds of points in a matter of moments, and by the end of the day had passed by far its previous record for a one-day drop, 684.81, set in the first trading day after the Sept. 11, 2001, terror attacks.

The selling was so intense that just 162 stocks rose on the NYSE -- and 3,073 dropped.


The Worst One-Day Percentage Losses for the Dow, S&P 500 and Nasdaq
from Trader Mike by Michael

On days like today we always see headlines about how the day’s point losses rank for the indices. But I’m always interested in where the moves rank on a percentage basis because that’s the only way to do a comparison against history. A -777 Dow today, while a record point loss, was *only* a 7% loss and doesn’t rank in the top 5 all-time but it is the 5th worst post-1940 or so. We’re certainly seeing historic moves right now. So here are some of the worst percentage days for the major indices:

Today was the third worst one-day decline for the Nasdaq. Here are the 10 worst percentage losses for the Nasdaq:

* October 19, 1987: -11.35%
* April 14, 2000: -9.67%
* September 29, 2008: -9.14%
* October 26, 1987: -9.01%
* October 20, 1987: -9.00%
* August 31, 1998: -8.56%
* April 3, 2000: -7.64%
* January 2, 2001: -7.23%
* October 27, 1997: -7.16%
* December 20, 2000: -7.12%

The S&P 500 had its second worst day since 1950. (The data’s from Yahoo Finance and only goes back to 1950. The S&P 500 index was created in 1957, but it has been extrapolated back in time.) Here are the 10 worst one-day percentage losses for the S&P 500::

* October 19, 1987: -20.47%
* September 29, 2008: -8.79%
* October 26, 1987: -8.28%
* October 27, 1997: -6.87%
* August 31, 1998: -6.80%
* January 8, 1988: -6.77%
* May 28, 1962: -6.68%
* September 26, 1955: -6.62%
* October 13, 1989: -6.12%
* April 14, 2000: -5.83%

There are a lot of October & September dates in that list!

And finally the Dow. I’m not sure where today’s drop ranks but it’s not in the top 5 (via Dave Manuel).

* October 19, 1987: -22.61%
* October 28, 1929: -12.82%
* October 29, 1929: -11.73%
* November 6, 1929: -9.92%
* December 18, 1899: -8.72%

From the data I pulled from Yahoo Finance, which only goes back to 1928, today was the 17th worst day since 1928.. It was the fourth worst in modern times — which is probably a better measure given how different the world is now. Given all the circuit breakers put in post the 1987 and 1989 “market breaks” it would be real difficult (if not impossible) to get another 22% down day. Here’s the modern top five worst Dow days:

* October 19, 1987: -22.61%
* October 26, 1987: -8.04%
* October 27, 1997: -7.18%
* September 17, 2001: -7.13%
* September 29, 2008: -6.98%

Post from: Trader Mike's Blog

Saturday, September 27, 2008

价值投资者阅读书单 (zt)

价值投资者阅读书单

股友“加有化”曾与我分享他的一个价值投资者阅读书单,附在这里,也与其他价值投
资初学者分享——

  Elementary School (小学)


  - One Up on Wall Street,(彼得林奇的成功投资)by Peter Lynch(彼得林奇)

  - Buffett: The Making of an American Capitalist(一个美国资本家的成长-巴菲特传), by Roger Lowenstein

  - value Investing With the Masters(跟大师学价值投资), by Kirk Kazanjian (0735203210)

  - The Davis Dynasty(戴维斯王朝——五十年华尔街成功投资历程), by John Rothchild

  - valuegrowth Investing(价值成长型投资), by Glen Arnold
  

  Junior High (初中)


  - The 5 Keys to value Investing(价值投资五大关键), by J. Dennis Jean-Jacques

  - Beating the Street(战胜华尔街), by Peter Lynch(彼得?B7林奇)

  - Investment Fables(打破神话的投资十诫), by Aswath Damodaran

  - The Vest Pocket Guide to value Investing(价值投资手册), by C. Thomas Howard

  - Common Stocks and Uncommon Profits(怎样选择成长股), by Philip Fisher (菲利普.费雪)

  
  High School (高中)


  - Made in America(美国制造), by Sam Walton (萨姆.沃尔顿)

  - Forbes' Greatest Investing Stories( 福布斯最大投资传奇), by Richard Phalon

  - John Neff on Investing(约翰.聂夫谈投资), by John Neff (约翰.聂夫)

  - The Intelligent Investor(聪明的投资者), by Benjamin Graham (本杰明.格雷厄姆)

  - The Money Masters(金融大师), by John Train

University (大学)

  
  - Stocks for the Long Run(股史风云话投资(第3版散户投资正典)), by Jeremy Siegel (西格尔)

  - Quality of Earnings(盈利的质量), by Thornton Oglove (0029226309)

  - Investing in Small-Cap Stocks(投资小盘股), by Christopher Graja and Elizabeth Ungar

  - The Book of Investing Wisdom(投资智慧书), by Peter Krass

  - You Can Be a Stock Market Genius(你能成为股市天才), by Joel Greenblatt

  
  Grad School (研究院)
  

  - Break Up!(分裂), by Campbell, Koch & Sadtler

  - Investment Gurus(投资大师), by Peter Tanous

  - value Investing: A Balanced Approach(《价值投资:平稳途径》), by Martin Whitman

  - value Investing: From Graham to Buffett and Beyond(价值投资:从格雷厄姆到巴菲特及其他), by Bruce Greenwald

  - The Road to Serfdom(通往奴役之路), by F.A. Hayek (哈谢克)

  
  Post-Doc 1: (博士后1)

  - It's Earnings that Count(起作用的是盈利), Heiserman

  - The Five Rules for Successful Stock Investing(股市真规则), Dorsey

  - Inside Intuit(Intuit公司内幕), Taylor & Scroeder

  - Pour Your Heart Into It(星巴克咖啡王国传奇), Schultz & Yang

  - Investment Philosophies(投资哲学), Damodaran

  
  Post-Doc 2: (博士后2)

  - Damodaran on Valuation(价值评估,另一个译本译名:论价值:投资与公司财务安全性分析), Damodaran

  - Contrarian Investment Strategies: The Next Generation(反向投资策略:升级版), Dreman

  - Moneyball(钱与球: 在不公平比赛中获胜的艺术), Lewis

  - Investment Intelligence From Insider Trading (从内线交易中获得的投资情报)

  - Financial Shenanigans(财务诡计), Schilit

Post-Doc 3: (博士后3)

  - Bull! A History of the Boom, 1982-1999,(牛市!1982-1999的市场繁荣历史)Mahir

  - Wall Street: A History,(华尔街史) Geisst

  - The Effective Executive(有效的管理者), Drucker (彼得.德鲁克)

  - The Essential Drucker(管理大师德鲁克精华), Drucker (彼得.德鲁克)

  - The Essays of Warren Buffet(巴菲特致股东的信:股份公司教程), Buffet

  
  Post-Doc 4: (博士后4)

  - Letters to Shareholders: Warren Buffet (巴菲特致股东的信)

  - Letters to Shareholders: Charlie Munger (芒格致股东的信)

  - Bershire Hathaway Owners Manual(伯克夏所有者手册), Buffet (以上三个
见伯克夏网站)

  - The Dark Side of Valuation(深入价值评估), Damodaran

拉杂这么许多,再次对但总表示敬意和感激。

Tuesday, September 23, 2008

Bond, (zt Murphy)

MORE SUPPLY ISN'T GOOD FOR BONDS... One of the side-effects of the massive government bailout plan is that it is going to have to sell a lot of bonds to raise that money. That means the supply of Treasury bonds is going to increase. When the supply of any product increases, its price usually falls. That reality may explain why Treasury bond prices have fallen so hard over the past week. There are technical factors at work as well. Chart 1 shows the 7-10 Year Treasury Bond ETF (IEF) tumbling over the past week in heavy trading. Part of the reason for Friday's bond slide may have been some switching out of bonds into rising stocks. But there may be more at stake here. Bond prices may be putting in an important top. Chart 1 also shows that the September bond peak failed at its March high. That raises the possiblity of a "double top" in the making.
\

LONGER TERM RESISTANCE... Chart 2 shows another reason why the recent setback in bond prices is so important. The monthly bars show the price of the 10-Year Treasury Note (UST) also backing off its previous peak formed in mid-2003. That makes that a potential major resistance barrier and increases the likelihood that bond prices could be forming a major top. Whether or not that turns out to be good for stocks remains to be seen. In recent years, bond and stock prices have usually trended in opposite directions. Money moving out of bonds has usually moved into stocks. The bigger question is whether or not the stock market can prosper in a climate of falling bond prices and rising bond yields.

Friday, September 19, 2008

这次call底还不错


"What a week! After the Treasury/FED decided to test the market by letting LEH file chapter 11 on monday, the market responded. On monday the DOW dropped 500 points. On tuesday the insurance giant AIG failed and the Treasury effectively nationalized them. Then on wednesday the DOW dropped 450 points more, Gold was rocketing, short term rates were in a free fall, credit was freezing up, and MS/GS were collapsing. With the banks under significant pressure, BSC/LEH/MER already gone, AIG and other insurance companies under pressure, and now the money markets wavering, something had to be done and fast. Hundreds of billions of dollars, by central banks worldwide, were injected overnight into the markets to address liquidity. On thursday as the markets continued to fall extraordinary steps were taken. The SEC invoked the ban on naked short selling again. The UK took it a step further, banning all short selling until next year. As the market gyrated, word came out that a massive government plan was being put together to address the financial markets. The markets recovered and the DOW closed up 400 points. On friday before the open, the SEC invoked a two week ban on all short selling. The Treasury announced it was buying FNM/FRE paper, etc. Markets went soaring worldwide. Then on options expiration day the US markets opened with a huge gap up of over 4%. The major bailout plan is being worked on this weekend by the President, Congress, the FED and Treasury."
From the ELLIOTT WAVE lives on

===========================================================================

发信人: yyber (总结过去,展望未来), 信区: Stock
标 题: 简单说一下今天的情况
发信站: BBS 未名空间站 (Tue Sep 16 23:03:45 2008)

1.SPX touched 1170 at market open. On monthly chart,it 50% retreat from
2003 bottom to 2007 top.

2.Today's volume is the largest in past three years,probably past several
years.

3.VIX reached to 33.x and closed with a read candle.

4.CPC was 1.47 yesterday, you can check its history.

5. COMPX finally formed a triple bottom.Actually it opened at 2142, which is
lower than March low and closed above yesterday's close. Interesting.

6. 20 is a very import support for XLF. It closed below 20 yesterday, opened
at 18 today and climbed all the way up to close at 20.2. Is this a typical
bear trap?

7. There were divergence on NYAD. Simply say, only 210 common stocks made
fresh 52-week lows in the NYSE Composite universe, versus about 450 in July
and over 700 in January.

8. To be continue....

***For trend follower,they need a major a accumulation day and a higher low,
higher high. Some traders may want to see QQQQ above 46 and SPX above 1260
before taking long potions. But I am not that kind of style now. Trend
follow just doesn't work for this kind of market,.

=====================================================================================
====================================================================================

发信人: yyber (总结过去,展望未来), 信区: Stock
标 题: 靠,全埋葬起来
发信站: BBS 未名空间站 (Wed Sep 17 16:08:44 2008)

剩下的50%打死我也不出手了,留个东山再起的本钱!

--==================================================================================
发信人: yyber (总结过去,展望未来), 信区: Stock
标 题: 衷心感谢C帅
发信站: BBS 未名空间站 (Wed Sep 17 17:18:52 2008)

C帅说过:

money management》操作》大盘》stock pick!!

幸亏我牢记在心,不然这次又要被wipe out了!昨天几乎都想要上50%的。后来想别急
,反正已经有了20%了,高开我也没踏空,低开了看情况再加仓!

====================================================================================

发信人: yyber (总结过去,展望未来), 信区: Stock
标 题: Same conclusion with yesterdays
发信站: BBS 未名空间站 (Wed Sep 17 20:19:33 2008)

虽然今天进去的又被套住了。

不过我还是相信TA就是讲概率。注意money management就行了。

我看金子明天还怎么涨,纯粹是panic!

http://www.mitbbs.com/article/Stock/31466653_3.html

==================================================================

发信人: yyber (总结过去,展望未来), 信区: Stock
标 题: so far today
发信站: BBS 未名空间站 (Thu Sep 18 12:55:05 2008)

不加,不减,不怕,不慌!

边打游戏边看盘。
--

=======================================================================

发信人: yyber (总结过去,展望未来), 信区: Stock
标 题: I think it is over
发信站: BBS 未名空间站 (Thu Sep 18 13:17:20 2008)

今天的最底应该是过了。

错了请封我10天!!

============================================================================

发信人: yyber (总结过去,展望未来), 信区: Stock
标 题: 狂想1
发信站: BBS 未名空间站 (Thu Sep 18 13:40:03 2008)

aapl close 135 tomorrow!
--
============================================================================

发信人: yyber (总结过去,展望未来), 信区: Stock
标 题: swing trader
发信站: BBS 未名空间站 (Thu Sep 18 13:52:17 2008)

just buy now,with a stop at today's low!
reward》risk!
--
==========================================================================

发信人: yyber (总结过去,展望未来), 信区: Stock
标 题: It is time to sit tight
发信站: BBS 未名空间站 (Thu Sep 18 15:41:50 2008)

for swing trader!

Today's low should be a low for quite long time, I believe!

Thursday, September 18, 2008

COMPARISON TO 2000-2002 BEAR MARKET (Murphy)

The current bear market has lasted only half as long as the 2000-2002 bear and has lost only half as much ground. Some have asked if this could be a repeat of that earlier market drop. I don't have the answer to that, but I do think there's a good chance that the market will bounce during the fourth quarter. Take a look at Chart 3. It compares the S&P 500 (green line) to the VIX Index (red line) during the earlier bear market. The VIX spiked during the the third quarters in 2001 and 2002. Both spikes led to bottoms in the September/October period and fourth quarter rallies. The 2001 rally, however, lasted only until the first quarter of 2002 before turning back down. The October 2002 bottom turned out to be the real thing. I don't know which of those two scenarios matches the current situation. In either case, however, there's a good chance that the market is approaching a climax bottom of some type which could lead to a fourth quarter rebound. And it should coincide with a peak in the VIX. That's one of the reasons why I advised earlier in the week not to turn too bearish at this point.

A reverse day

化肥,都忘了吧

好钢留在刀刃上!

http://yyber.blogspot.com/2008/08/mos.html


This time, I think we should play tech and Chinese concept

三大板块:xlf,qqqq,xle!

xlf,我觉得应该是在20-23之间波动。
xle,still downtrend,阻力重重。

tech:

AAPL
上次aapl在120到130之间慌了一个多月,突破130的时候没抓住,最后it绝尘而去,我
错过一个大波,记忆特别深刻!

RIMM:
80 is the pre-split price,the price range has been touched today!

GOOG:
410 is a very decent support from 2006.

中概:
我will just play FXI,FMCN and MR,中概的庄都很不一般,一个星期上下50%常见的很。看准合适入点后不要轻易被忽悠了。

觉得暂时先不要碰RSX,两大集团最近斗争的很厉害。

Tuesday, September 16, 2008

Today may be a major bottom

发信人: yyber (总结过去,展望未来), 信区: Stock
标 题: 简单说一下今天的情况
发信站: BBS 未名空间站 (Tue Sep 16 23:03:45 2008)

1.SPX touched 1170 at market open. On monthly chart,it 50% retreat from
2003 bottom to 2007 top.

2.Today's volume is the largest in past three years,probably past several
years.

3.VIX reached to 33.x and closed with a read candle.

4.CPC was 1.47 yesterday, you can check its history.

5. COMPX finally formed a triple bottom.Actually it opened at 2142, which is
lower than March low and closed above yesterday's close, forming a strong bullish engulfing bar with big volume. Interesting.

6. 20 is a very import support for XLF. It closed below 20 yesterday, opened
at 18 today and climbed all the way up to close at 20.2. Is this a typical
bear trap?

7. There were divergence on NYAD. Simply say, only 210 common stocks made
fresh 52-week lows in the NYSE Composite universe, versus about 450 in July
and over 700 in January.

8. To be continue....

***For trend follower,they need a major a accumulation day and a higher low,
higher high. Some traders may want to see QQQQ above 46 and SPX above 1260
before taking long potions. But I am not that kind of style now. Trend
follow just doesn't work for this kind of market,.

Economic Indicators Most Sensitive to Stocks

Rank Indicator Page
1 Employment Situation Report (Payroll Survey) 25
2 ISM Report—Manufacturing 147
3 Weekly Claims for Unemployment Insurance 38
4 Consumer Prices 245
5 Producer Prices 255
6 Retail Sales 62
7 Consumer Confidence and Sentiment Surveys 86 and 91
8 Advance Report on Durable Goods 116
9 Industrial Production 137
10 GDP 100

Saturday, September 13, 2008

Thursday, September 11, 2008

Trading On News---from AlphaTrends by Brian

No closing video today, I am out of town. Here is an excerpt from MY BOOK

You may be wondering what a chapter on news is doing in a book about technical analysis. A technical purist would take a closed-minded approach, indicating that “fundamentals don’t matter because the chart tells all.” Just as many fundamentally oriented managers express their perceived disdain for technical analysis (“Reading charts is like reading tea leaves.”).

The practical truth is that participants place their trades based on analysis of both fundamentals and technicals, and to completely ignore either is foolish. Don’t start thinking that I’m talking out of both sides of my mouth here – 95 percent of this book is dedicated to technical analysis, and the other five percent to this chapter. All of my timing decisions are based on price, not news or fundamentals.

Human nature is to ask questions. People want to know the “why” of those things they don’t understand right away. The markets are no different. All of us try to assign order to chaos, and crowd behavior in reaction to news frequently is very chaotic. We often do this instead of focusing on why a stock has already moved.

Personally, I want to know why people buy stocks in much more general terms. More importantly, though, I want to anticipate what their next move might be, when it may occur, how much risk to take and how much can I make if my analysis is correct.

In the market, the answer to why isn’t always easy to understand. Fortunately for traders, it doesn’t always matter. Interpreting news and committing capital based on our views of those events is very one- dimensional, just as monitoring the actions of just one participant is one-dimensional. But correctly interpreting human nature and crowd behavior is really what understanding technical analysis is all about. What causes one participant to buy or sell has very little significance beyond a couple of days.

It has been shown over and over again that no one is bigger than the markets -- remember Long Term Capital Management, Amaranth Partners, Bear Stearns and some of the other large “smart money” participants who went down in flames? If a very large participant attempts to move a stock – or even the market -- it can be accomplished for short periods of time, but it is very risky because it puts that institution in a large and likely difficult-to-liquidate position if the market moves against them quickly. Without proper risk controls in place, even the largest market participants can be forced out of business. Incidentally, many of the stocks you will trade successfully with a short-term timeframe are the recipient of a participant attempting to move prices in a particular direction.

Fundamentals Do Make Market Participants React
Fundamentals do matter because they are often the catalyst that causes a large group of participants to take buy or sell actions. There are many technical traders who buy breakouts or sell a stock short as it breaks below support. On a larger scale, there are more participants who buy and sell stocks based on their perceptions of a company or its products.

News releases are the biggest catalysts for participants to reevaluate their thinking about a company and make position adjustments based on expectations and ideas of value gained from the new information. News triggers emotion, and that emotion triggers actions that can be measured on price charts.

In college we are taught to evaluate a company based on its fundamentals, while technical study is given almost no attention. I learned a great deal in business school, but very little of it has helped me to become a good trader. What has helped me attain trading success with fundamental information is an understanding of when it makes sense to pay attention to these catalysts as it gives me insight into the psychology of the fundamental crowd.

I do believe that “the market knows all” and also that “news and surprises tend to follow the direction of the primary trend.” One of the principles of technical analysis is that the market discounts the past and anticipates the future. Whether it is anticipating where the economy will be in six to twelve months or the lifecycle of a business product, the smart money attempts to position its holdings to take advantage of emotional responders to the news when it is released. Financial analysis is big business, and institutions pay millions of dollars per year to access information based on in-depth analysis of what the future may hold for the economy, a market sector or an individual stock – and for good reason. It is the goal of an institution to accumulate shares before the “good news” is known to the majority of participants so they can be in a position to sell shares as price and volume expand.

When positive news is released, it is usually the public who buys from professionals. When negative news is released the coin flips, and professionals are often the buyers from the emotional public. The smart money buys temporary setbacks in a bull market and sells their long positions on short-term rallies in a bear market. It is common for strong markets to ignore negative news (“climb a wall of worry”), while weak markets react quickly and severely. Bear markets tend to ignore positive news and slide down a “slope of hope” or react with limited enthusiasm.

Today’s near-instant dissemination of information can be an undisciplined trader’s worst nightmare. Inexperienced and uneducated market participants -- the “dumb money” -- are more likely to be motivated by news headlines, chat room gossip, etc., and the market dutifully punishes their lack of thoughtful preparation with losses. Simply put, professionals anticipate while amateurs react.

===========================
As discussed, emotions are the enemy in trading, and it is easy to get caught up in the hype of a news story whether it appears to be bullish or bearish. Slowing down and introspectively answering questions about a news release can help keep you from making a knee-jerk reactionary buy or sell.

 Does it look like the information was “priced into the market” prior to the release? If the stock made a significant move in the days before the news report, there is a good chance that the move will fail, as the participants who anticipated the event will take advantage of news hype to liquidate their position and thereby extinguish the trend.

 Is it even news? There are times when smaller companies will “repackage” a news release in order to get more attention than the first time it was released. Small companies also will try to associate themselves with larger companies in an attempt to make their company appear more legitimate and stir up an emotional response from overly optimistic participants. Unfortunately for trusting buyers, news releases are sometimes used to generate public interest in a situation that may not be as optimistic as it appears.

 Is there a pattern to how the stock has acted when similar news was released? A good example of this would be quarterly earnings reports.

Answering these and similar questions allows you to slow your reaction to news headlines and think a situation through before deciding to commit your capital to a trade. You should be more interested in understanding the psychology of participants and what motivates them to buy or sell than knowing the fundamentals of a business.
================================

Once the news (for the economy or a stock) has been released, traders should be less interested in interpreting the news itself and focus more on how the market reacts to it. With that in hand, it’s easier to either ignore the news and focus solely on price action or find a low-risk way to exploit any subsequent movements.

Treat price reactions cautiously. Let the market first absorb the short-term emotional response, and then focus on the unfolding market action to determine if there will be a lasting impact that can be exploited in a low- risk manner. Some of the common actions following a news release are:

 The reaction can fizzle out (Figure 14.1), and the stock enters a period of inactivity (avoid these stocks).

 Significant news can create a new trending environment. If a stock breaks out of a longer-term consolidation after a news release, there is a high likelihood that the new trend will be able to sustain the move, particularly if the breakout is accompanied by a surge in trading volume. (Figure 14.2)

 When a stock is already in an established trend, news releases will often motivate enough participants to take action and accelerate an existing trend.

 Occasionally a true surprise catches a large group of participants off guard, and sentiment changes so drastically that the stock may reverse the prevailing trend.

Below are a few of the potential big catalysts of which you should always be aware.

Perfect Fib day

Dow opened -200 point and closed +160 point.What an amazing day!

At the opening, I told myself don't jump on short side from the reading of PCP and VIX. And also it is 9-11. I am right although I did not know it was up that much at the last 5 minutes.

weak rebound (zt Quantifiable Edges)

The first day of a bounce can sometimes be a good indication of whether that
bounce is likely to succeed or roll over. I recently showed an example of
how a weak bounce (price-wise) can suggest a downside edge. That study is in
effect again tonight.

Breadth can also be important to watch. After seeing down volume account for
about 90% of total NYSE volume during Tuesday’s selloff, today’s bounce
higher only rebounded with about 56% up volume. I performed a study which
looked at other times the market dropped at least 2% on over 85% down volume
on day 1 and then rose on under 60% up volume on day 2.

The setup was fairly rare from 1970-2000, triggering 15 times in 31 years.
There was no discernable edge over this period of time, either. From 2001
through today it has triggered 14 times and consistently predicted downside.
Below are some statistics on those instances:


In the last 13 months the frequency of occurrences has picked up
tremendously. Wednesday marked the 8th instance since August 2007. The
previous 7 instances are listed below with a 6-day exit.

Wednesday, September 10, 2008

TLT(zt Murphy)

DÉJÀ VU FOR BONDS... Bonds surged over the last two weeks as money moved from risky assets to relative safety. Chart 3 shows the iShares 20+ Year Bond ETF (TLT) with the S&P 500 ETF (SPY). TLT surged to its highest level since January–March 2008. These two months also marked flights to safety when investors gobbled up bonds. The credit crisis was just getting warmed up in January when the Fed introduced its Term Security Lending Facility for $30 billion. In addition, the Fed slashed the discount rate and the federal funds rates 1 ¼% in January. This drastic Fed action spurred a relief rally on Wall Street and bonds pulled back from their highs. This was short-lived as bonds surged again in March with the Bear Stearns collapse. The Fed came to the rescue again and this prompted another peak in bonds (green arrow). Stocks bottomed and moved sharply higher from mid March to mid May. Flash forward six months and we are witnessing the Fannie Mae/Freddie Mac bailouts as well as the Lehman (LEH) liquidity rumors. This prompted another flight to safety and a sharp decline in stocks. Will these latest maneuvers spark another rally for stocks? Watch bonds for clues. Bonds are benefiting as investors shun riskier assets (stocks) in favor of safe returns. A decline in bonds would show less fear and this could benefit stocks. Money from bond sales would have to be put to work elsewhere — possibly in stocks.

Monday, September 8, 2008

GAP


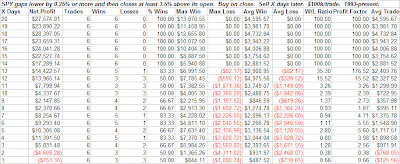
It's Monday morning and the futures are up over 3.0% due to the FNM/FRE bailout news. Since 1998 there have been 16 times when the S&P 500 has gapped up 2.0% or more. Eight of those times it closed higher than the open, and eight it closed lower.

Of the 16 instances 10 saw an intraday drop of 1% or more from the opening price and 6 did not.

12 of the 16 broke below the lows of the 1st half hour of trading at some point during the day. Shorting that break and holding until the end of the day would have resulted in 6 winning trades and 6 losing trades.

5 of them broke the lows of the 1st half hour after 10:30am. Of those, 4 went on to close even lower on the day. The lone instance that rebounded closed almost 3% higher, though.

So far I've yet to indentify a sizable edge for trading a gap this large on an intraday basis. I will update further if I do.

(from Quantifiable Edges)

Sunday, September 7, 2008

Saturday, September 6, 2008

Divergence!

Be careful to time frame.

Friday, September 5, 2008

Proud myself

发信人: yyber (总结过去,展望未来), 信区: Stock
标 题: 整理一下,看能不能骗村长一个包子
发信站: BBS 未名空间站 (Thu Sep 4 20:14:44 2008)

发信人: yyber (总结过去,展望未来), 信区: Stock
标 题: satelite II
发信站: BBS 未名空间站 (Wed Aug 27 11:53:17 2008)

tomorrow's GDP push market up 200+!

============================================================================
==

发信人: yyber (总结过去,展望未来), 信区: Stock
标 题: Re: yyber, say say next tuesday bah.
发信站: BBS 未名空间站 (Fri Aug 29 16:04:24 2008)

I think it is up!

It is not easy to break 46. Given AAPl broke 172 and RIMM broke 125 today,
if it can not hold 46 next Tue, the big picture will turn to really bearlish!

============================================================================
======
发信人: yyber (总结过去,展望未来), 信区: Stock
标 题: very disppointed
发信站: BBS 未名空间站 (Tue Sep 2 16:30:02 2008)

to bulls!
=====================================================================
发信人: yyber (总结过去,展望未来), 信区: Stock
标 题: 我对昨天的理解
发信站: BBS 未名空间站 (Wed Sep 3 10:20:13 2008)

和C帅一样。

Fund manager好不容易抓住机会了,赶紧跑吧。也不要做样子了,也不管什么46的支撑
不支撑了。跑的早的掉层皮,跑的完的砍大腿。
=============================================================================

发信人: yyber (总结过去,展望未来), 信区: Stock
标 题: 不想吓大家
发信站: BBS 未名空间站 (Wed Sep 3 11:43:25 2008)

昨天46那么容易都被破了,想想这里面的道理吧!

C帅说过,大fund逃走的时候,才不管你什么TA呢。所以我今天就是不看图操作!
============================================================================
====

发信人: yyber (总结过去,展望未来), 信区: Stock
标 题: 打游戏去了
发信站: BBS 未名空间站 (Wed Sep 3 11:59:14 2008)

就早上买的那几个put,翻番了就卖。

JRCC到达目标,出手了!虽然it折磨了好久。
============================================================================
===

发信人: yyber (总结过去,展望未来), 信区: Stock
标 题: 其实牛牛早就不行了
发信站: BBS 未名空间站 (Thu Sep 4 10:46:59 2008)

还等明天的data干什么呢?

We had an excellent GDP, so what? We had a sharp drop in OIL, so what?

When 46 was broken, they said, ok, let's wait 1260. Now you know 1260 is
just as 46, it is nothing!

Don't tell me finance is still strong? Can you read chart?

================================================
发信人: yyber (总结过去,展望未来), 信区: Stock
标 题: 看了一圈图
发信站: BBS 未名空间站 (Thu Sep 4 16:43:19 2008)

还是觉得明天要涨。

声明一下,我现在没什么空仓了,也许是bias!

Happy on ICE and FMCN

发信人: yyber (总结过去,展望未来), 信区: Stock
标 题: 手快想抓反弹的
发信站: BBS 未名空间站 (Thu Sep 4 14:05:56 2008)

我推荐两个:FMCN,ICE!


FMCN W pattern, gap support, 50 MA support!

Thursday, September 4, 2008

An interesting article from Bespoke

We've compared the rallies of the tech and homebuilder bubbles with the rally in oil plenty of times here. Below we highlight the returns from trough to peak of the three asset classes during their respective bubbles. As shown, the Nasdaq went up 640% during its 1990s bubble, while the homebuilder stocks went up 839% during their 2000s bubble. From oil's bottom of $16.70 in November 2001 to its recent peak of $145.29 on July 3rd, the commodity rallied 770% -- right in between the rallies of the Nasdaq and homebuilder bubbles.


While it's pretty much unfathomable and also unlikely, we charted what the declines in oil would look like if the commodity took the same path as the Nasdaq and homebuilders on the way down. From peak to trough for the Nasdaq, it went down 77.93% over 647 trading days. From peak to trough for the homebuilders, the S&P 1500 Homebuilder index went down 78.38% over 750 trading days. For oil to match the Nasdaq crash, it would get all the way down to $32.06 by February 1st, 2011. For it to match the homebuilder crash, oil would fall to $31.40 by June 27th, 2011.

Again, odds are that oil has no shot of getting back to the $30s anytime soon, but since the rise in oil was very comparable to the tech and housing bubbles, it's interesting to see what a comparable decline would look like.

SKF


This chart is from Master chuxue!

Wednesday, September 3, 2008

some

UNG, APA, EOG

COF

XHB, TOL, CTX, LEN

GOOG, ICE