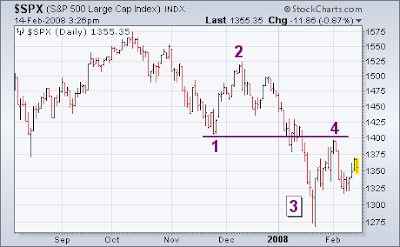
My prior statement about bear markets taking place in five waves is based on Elliott Wave theory. Let's apply the same analysis to the daily chart of the S&P 500. Chart 5 shows the S&P declining in three waves from early October to mid-January (two down waves with an intervening rally). One of the most important Elliott rules is that a wave 4 rebound should never move above the bottom of wave 1 (1400). That's why I recently suggested that the market would have difficulty clearing the 1400 level. As long as it doesn't, there's a strong likelihood of one more (fifth) downwave before the decline from last October is complete. There's another Elliott rule which is worth keeping in mind. Wave 5 is usually at least as long as wave 1. Wave 1 fell from 1575 to 1400 (-175 points). Subtracting that 175 points from the top of Wave 4 (1400) gives a potential target to 1225. The 1225 level corresponds to the bottom formed during the spring of 2006 (Chart 6). That's the next logical support level (and target) if the downtrend resumes. In order to disturb the orderly downtrend, the S&P 500 (and the other market indexes) would have to close decisively over their late-January highs.


No comments:
Post a Comment